
Hello Aspirants.
Welcome to Online Quantitative Aptitude section in AffairsCloud.com. Here we are creating question sample From Data Interpretation that is important for all the competitive exams. We have included Some questions that are repeatedly asked in exams.
Bank PO Level Questions :-
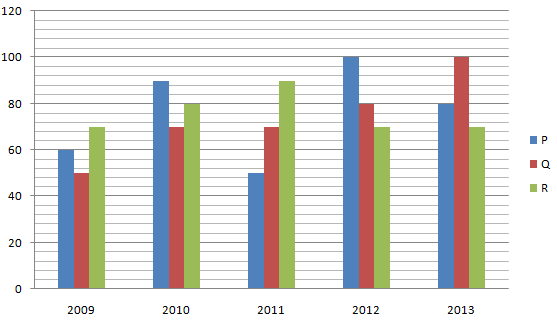
- The percentage increase in production of company Q from the year 2009 to the year 2013 is _______
A. 50%
B. 40%
C. 60%
D. 100%Answer – D. 100%
Explanation :
Increase in the production of the company Q from the year 2009 to the year 2013 is = [(100 -50)/50]*100 = 100%. - The Average production over the years 2009-2013 was maximum for the companies?
A. Q
B. P
C. R
D. P & RAnswer – D. P & R
Explanation :
Average production of Company P = [60+90+50+100+80]/5 = 76 lakh tonne
Average production of Company Q = [50+70+70+80+100]/5 = 74 lakh tonne
Average production of Company P = [70+80+90+70+70]/5 = 76 lakh tonne
P & R – Maximum production - The percentage rise or fall in production of company Q as compared to the previous year is the maximum in the year
A. 2010
B. 2011
C. 2012
D. 2013Answer – A. 2010
Explanation :
For Company Q
Percentage change in 2010 = [(70-50)/50]*100 = 40%
Percentage change in 2011 = [(70-70)/70]*100 = 0%
Percentage change in 2012 = [(80-70)/70]*100 = 14.28%
Percentage change in 2013 = [(100-80)/80]*100 = 25%
Q is the maximum in the year 2010. - The percentage of production of company R to production of company Q is the maximum in the year?
A. 2010
B. 2011
C. 2009
D. 2013Answer – C. 2009
Explanation :
The production of company R to production of Q
in the year 2009 = [(70-50)/50]*100 = 40%
in the year 2010 = [(80-70)/70]*100 = 14.28%
in the year 2011 = [(90-70)/70]*100 = 28.57%
For 2012 & 2013 – R is less than Q - The ratio of the average production of company P during the year 2011 to 2013 to the average production of company Q for the same period is ________
A. 11:13
B. 13:15
C. 17:19
D. 23:25Answer – D. 23:25
Explanation :
Average production of the company Q during the year 2011 – 2013 = [(50 + 100 + 80)/3]= 230/3 lakh tonne
Average production of the company Q during the year 2011 – 2013 = [(70 + 80 + 100)/3]= 250/3 lakh tonne
Required Ratio = 23:25
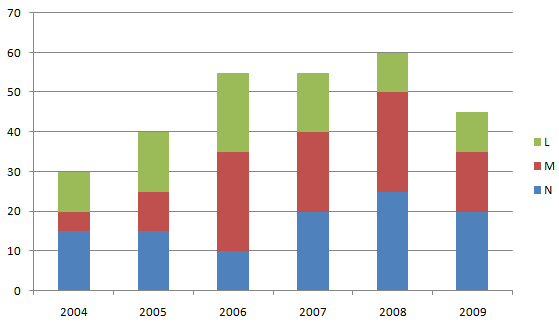
II. Study the given graph carefully to answer the questions that follow.
Number of people (in thousand) using three different types of mobile services over the years
- What is the total number of people using mobile service M in the years 2008 and 2009 together?
A. 35000
B. 30000
C. 25000
D. None of the AboveAnswer – D. None of the Above
Explanation :
Total number of people using mobile service M in the years 2008 and 2009 together = 25 + 15 thousand = 40 thousand - Number of people using mobile service N in the year 2006 forms approximately, what percent of the total number of people using all the three mobile services in that year?
A. 11%
B. 13%
C. 17%
D. 18%Answer – D. 18%
Explanation :
Number of people using mobile service N in the year 2006 = 10000
Total Number of people using all three mobile services in the year 2006 = 55000
Required Percentage = (10000/55000)*100 = 18%(approximately) - What is the respective ratio of number of people using mobile service L in the year 2005 to those using the same service in the year 2004?
A. 8:7
B. 3:2
C. 17:19
D. 23:25Answer – B. 3:2
Explanation :
Ratio = [number of people using mobile service L in the year 2005/number of people using mobile service L in the year 2004]
= 15/10 = 3:2 - The total number of people using all the three mobile services in the year 2007 is what percent of the total number of people using all the three mobile services in the year 2008?(rounded off two digits after decimal)
A. 92.69%
B. 91.67%
C. 94.65%
D. 95.68%Answer – B. 91.67%
Explanation :
Total number of people using all the three mobile services in the year 2007 = 55000
Total number of people using all the three mobile services in the year 2008 = 60000
percentage = (55000/60000)*100 = 91.67% - What is the average number of people using mobile service M for all the years together?
A. 50/3 thousand
B. 44/3 thousand
C. 55/3 thousand
D. 65/3 thousandAnswer – A. 50/3 thousand
Explanation :
Average number of people using mobile service M for all the years together = 100/6 = 50/3 thousand
AffairsCloud Recommends Oliveboard Mock Test
AffairsCloud Ebook - Support Us to Grow
Govt Jobs by Category
Bank Jobs Notification

