
Hello Aspirants.
Welcome to Online Quantitative Aptitude section in AffairsCloud.com. Here we are creating question sample From Data Interpretation that is important for IBPS, SBI, RRB,SSC and other competitive exams. We have included Some questions that are repeatedly asked in exams.
I. Refer to the Line Graph and answer the given questions. Number of Shirts of ‘X’ brand sold in Shop “A” and Shop “B” in 6 different months.
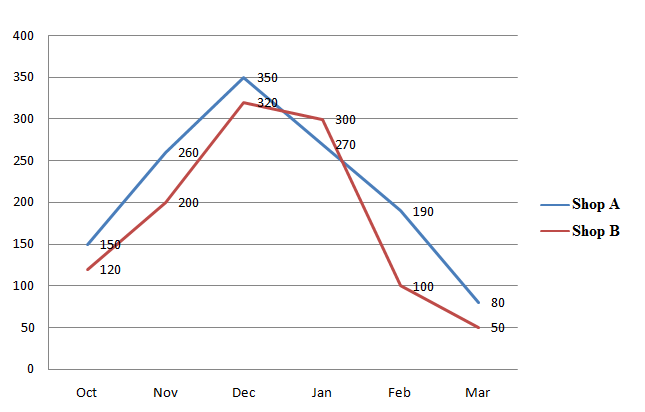
- The number of Shirts sold in Shop “B” increased by what percent from November to December?
1. 50%
2. 40%
3. 10%
4. 60%
5. None of the AboveAnswer – 4. 60%
Explanation :
= 320-200 = 120
= (120/200)*100
= 60% - What is the difference between the total number of Shirts sold in both the shops together in October, February & March and the total number of Shirts sold in both the shops together in January, November and December?
1. 1060
2. 1070
3. 1020
4. 1010
5. 1050Answer – 4. 1010
Explanation :
Shirts in October, February & March = 1700
Shirts in January, November & December = 690
Difference = 1700 – 690 = 1010 - The number of shirts sold in shop “A” in October, November and December is what % more than the number of shirts sold in Shop “B” in the same months?
1. 25/4%
2. 45/4 %
3. 55/4 %
4. 75/4 %
5. None of the AboveAnswer – 4. 75/4 %
Explanation :
Required Percentage
= [(760-640)/640]*100
= [120/640]*100 = 75/4% - What is the average number of Shirts in Shop “A” in October, November, December, February and March?
1. 205
2. 215
3. 207
4. 210
5. 206Answer – 5. 206
Explanation :
Explanation :
Avg = 150 + 260 + 350 + 190 + 80 = 1030 = 1030/5 = 206 - The total number of shirts sold in Shop “B” in September is 20% less than the number of shirts sold in same town in October. The total number of shirts sold in Shop “B” in April is 20% more than the number of shirts sold in same town in March. what is the respective ratio between the number of shirts sold in September and those sold in April in the same shop?
1. 2:9
2. 1:5
3. 4:9
4. 2:7
5. 8:5Answer – 5. 8:5
Explanation :
Shirts sold in Shop B in September
= 20% of 120 = 24 = 120-24 = 96
Shirts sold in Shop B in April
= 20% of 50 = 10 = 50 + 10 = 60
Ratio = 96 : 60 = 8:5
II. Study the following information carefully and answer the questions that follow:
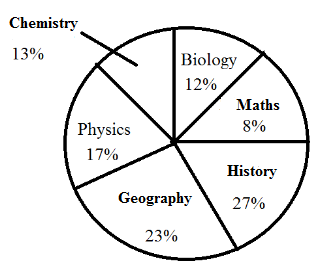
Percentagewise distribution of teachers who teach six different subjects
Total Number of Teachers = 1800
- If two-ninth of the teachers who teach Physics are females, then the number of male Physics teachers is approximately what percent of the total number of teachers who teach Geography?
1. 57%
2. 42%
3. 63%
4. 69%
5. None of theseAnswer – 1. 57%
Explanation :
Number of teachers in Physics = 17/100 * 1800 = 306
Number of male teachers in Physics = 7/9 * 306 = 238
Number of teachers in Geography = 23/100 * 1800 = 414
% = 238 / 414 * 100 = 57% - In History, number of male teachers and female teachers are in the ratio of 1:1. If one-third of the teachers who teach Geography are females and the percentage of female teachers in History equals to the percentage of female teachers in Biology then what is the total number of male teachers who teach Geography, History and Biology?
1. 624
2. 627
3. 776
4. 798
5. None of theseAnswer – 2. 627
Explanation :
Number of male teachers who teach Geography = 2/3 * 23/100 * 1800 = 276
Number of male teachers who teach History = 1/2 * 27/100 * 1800 = 243
% of female teachers who teach Biology = % of female teachers who teach Biology i.e 50%
Therefore Number of male teachers who teach Biology = 50/100 * 12/100 * 1800 = 108
Total = 276 + 243 + 108 = 627 - What is the difference between the total number of teachers who teach History and Physics together and total number of teachers who teach Chemistry and Biology together?.
1. 352
2. 362
3. 342
4. 353
5. None of theseAnswer – 3. 342
Explanation :
Total number of teacher who teach History and Physics = 44% of 1800
Total number of teacher who teach Chemistry and Biology = 25% of 1800
Difference = 19% of 1800 = 342 - If one – third of the teachers who teach Chemistry are females and the percentage of male teachers in Maths is 50%. What is the ratio of the male teachers who teach Chemistry to the number of female teachers who teach Maths?
1. 13 : 7
2. 7 : 13
3. 7 : 26
4. 13 : 6
5. None of theseAnswer – 4. 13 : 6
Explanation :
Number of male teachers who teach Chemistry = 2/3 * 13/100 * 1800 =156
Number of female teachers who teach Biotechnology = 1/2 * 8/100 * 1800 =72
Ratio = 156 : 72 = 13 : 6 - If the percentage of Chemistry teachers is increased by 50% and percentage of Maths teachers is decreased by 25%, what will be the total number of Chemistry and Maths teachers together?
1. 390
2. 379
3. 469
4. 480
5. 459Answer – 5. 459
Explanation :
Total number of teacher who teach Chemistry = 234 + 117 = 351
Total number of teacher who teach Maths = 3/4 * 8% of 1800 = 108
Total number of Chemistry and Maths teachers together = 351 + 108 = 459
AffairsCloud Recommends Oliveboard Mock Test
AffairsCloud Ebook - Support Us to Grow
Govt Jobs by Category
Bank Jobs Notification

